

Code
import matplotlib.pyplot as plt
def plot(films):
years = list(range(1976, 2027)) # Create a list of years from 1976 to 2024
plt.figure(figsize=(9,1)) # Adjust figure size for better visualization
plt.plot(years, [0] * len(years), color='black', linewidth=2) # Plot a horizontal line
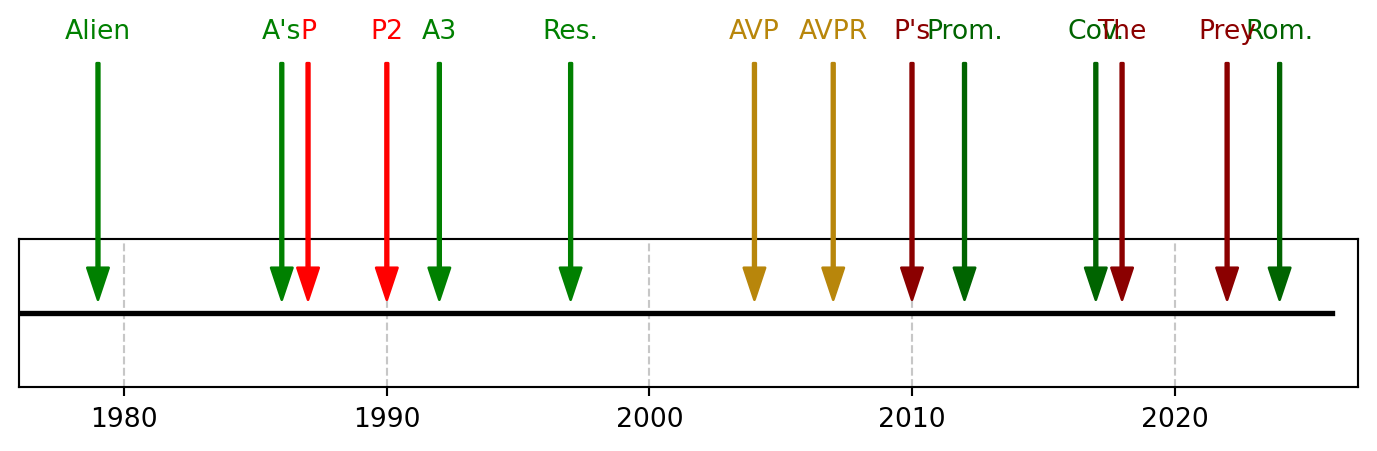
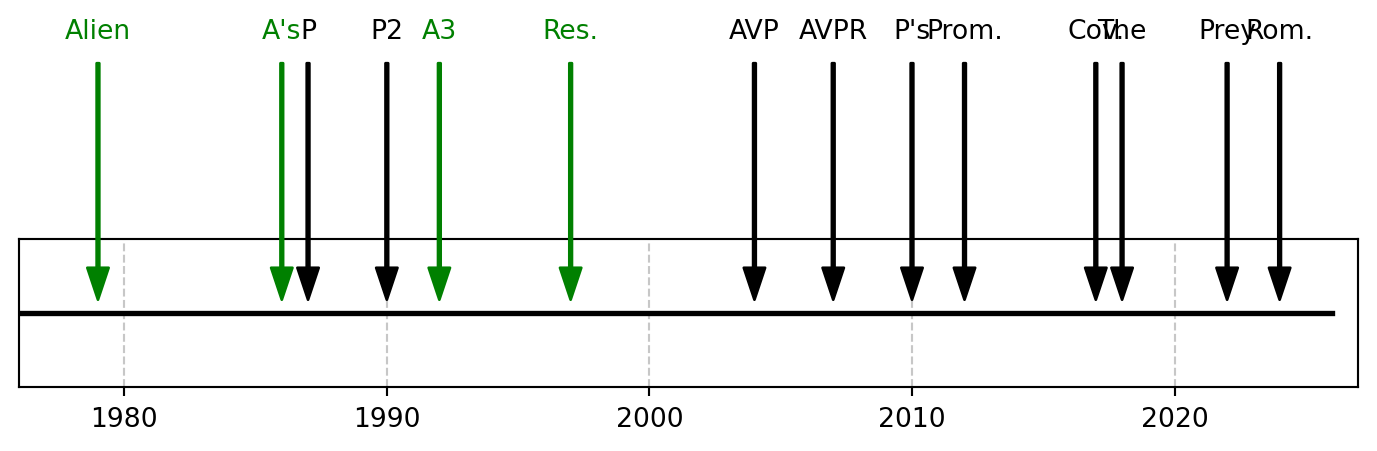
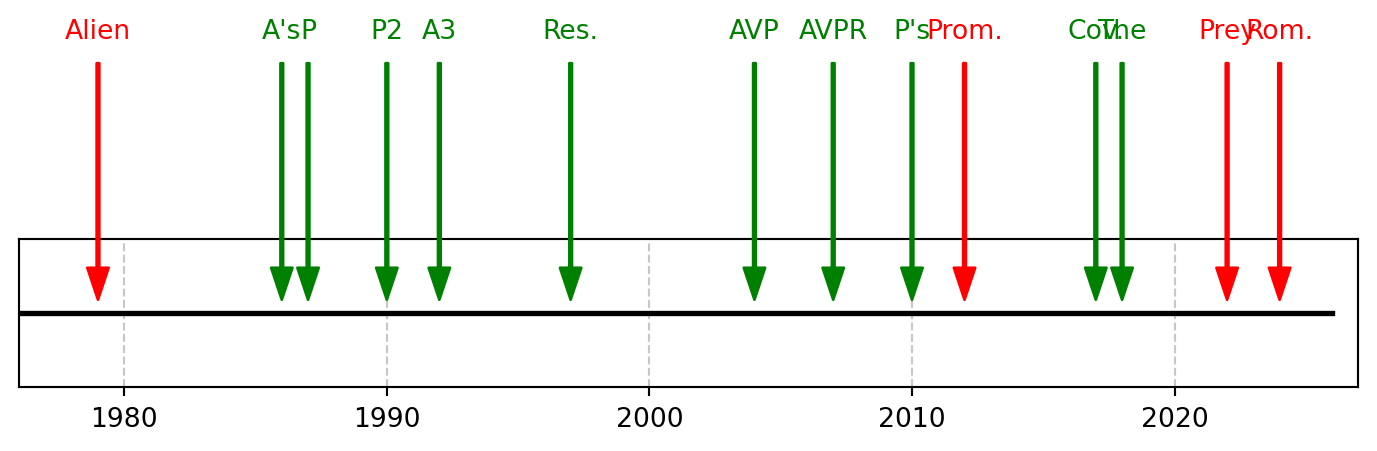
def add_film(name, year, color="green"):
plt.annotate(
name,
xy=(year, 0.0),
xytext=(year, 0.2),
arrowprops=dict(color=color, shrink=0.05, width=1, headwidth=8),
horizontalalignment='center',
verticalalignment='bottom',
fontsize=10,
color=color
)
[add_film(*film) for film in films]
plt.yticks([]) # Remove y-axis ticks as they are not relevant for a horizontal line
plt.grid(True, axis='x', linestyle='--', alpha=0.7)
plt.xlim(1976, 2027) # Set x-axis limits slightly beyond the data range
plt.show()
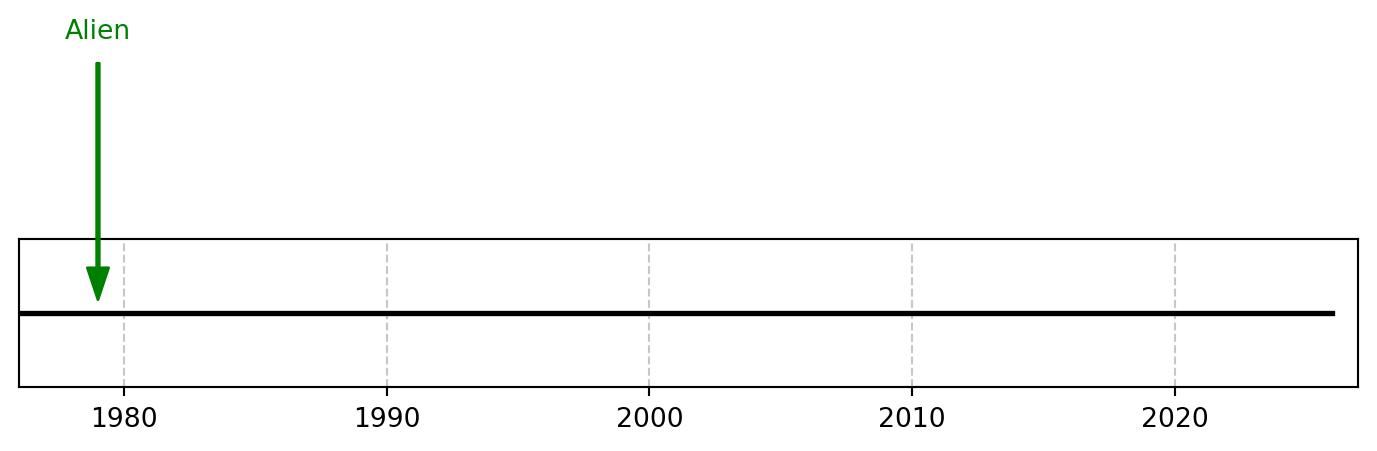
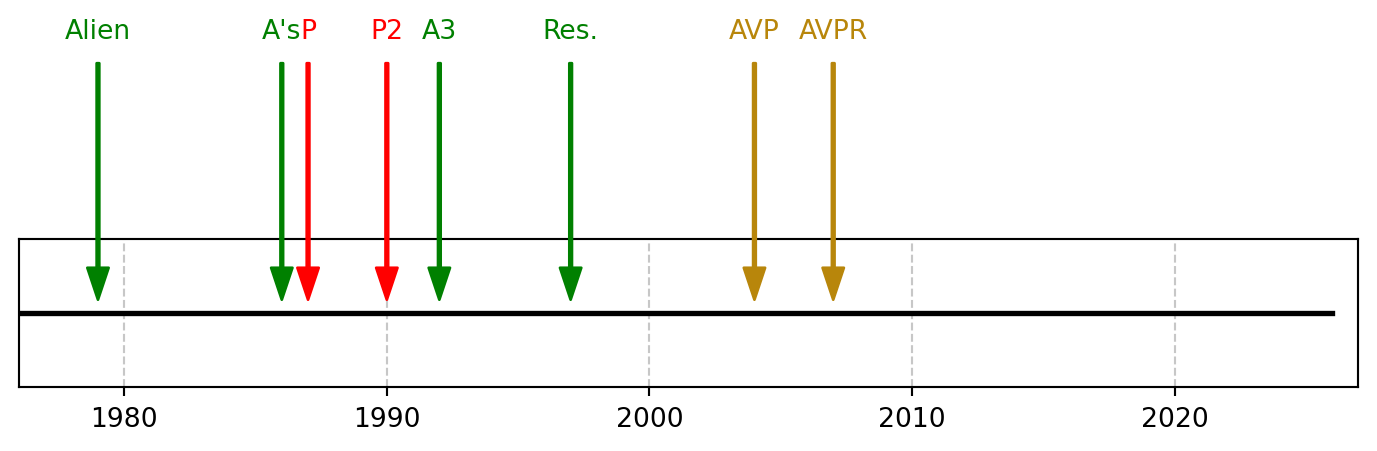
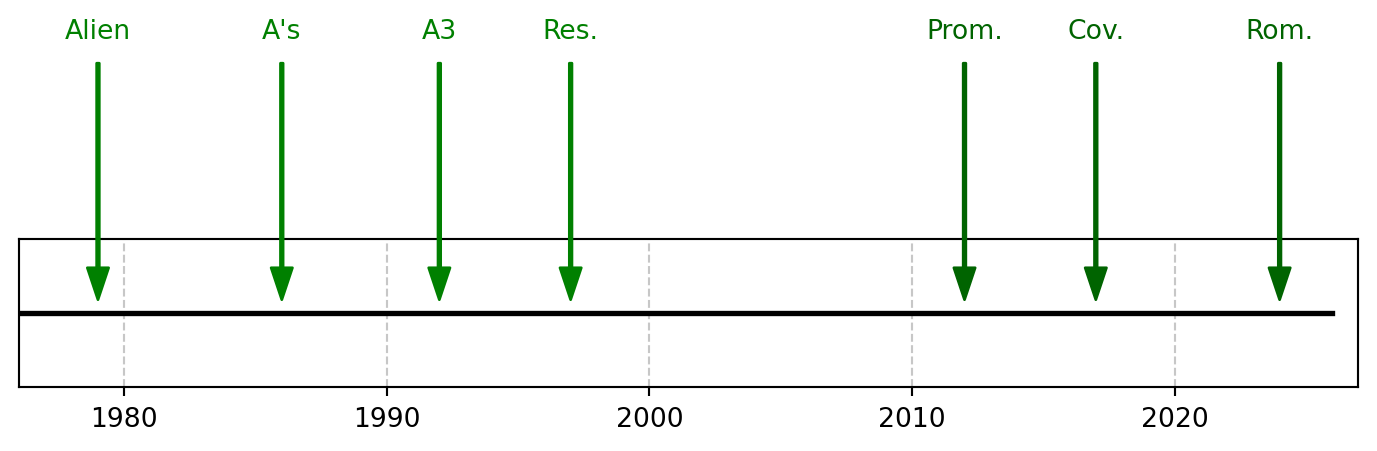
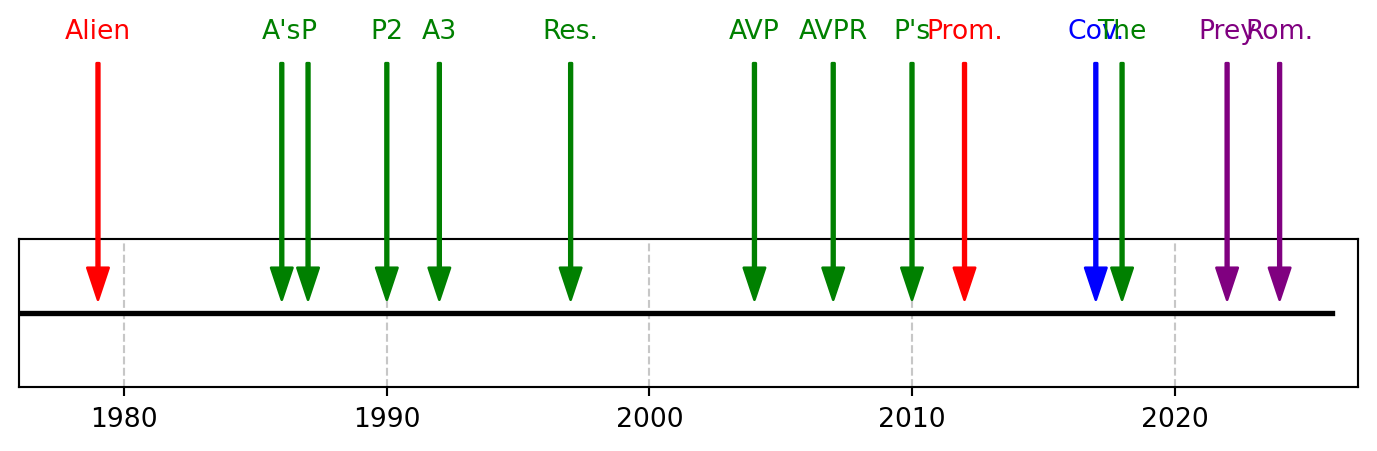
films = [
["Alien", 1979],
]
plot(films)